Collect and visualize MySQL server logs with the updated MySQL integration for Grafana Cloud

Today, we are excited to announce that the MySQL integration has received an important update, which includes a new pre-built MySQL logs dashboard and the Grafana Agent configuration to view and collect MySQL server logs.

The integration is already available in Grafana Cloud, our platform that brings together all your metrics, logs, and traces with Grafana for full-stack observability.

Why you need logs

Of all the three pillars of observability, metrics are the most widely used: They are easier to gather and store than logs or traces. They are great for detecting problems and understanding system performance at a glance. Still, metrics are often not enough to understand what caused an issue.

On the other hand, logs can tell you many more details about the root cause, once you narrow down the time and location of the problem using metrics.

Getting started with the MySQL integration

Grafana Agent is the universal collector and is all you need to send different telemetry data to the Grafana Cloud stack, including metrics, logs, and traces.

If you already use the embedded Agent integration to collect Prometheus metrics, your Agent configuration could look like this:

yaml

integrations:
  prometheus_remote_write:
    - url: https://<cloud-endpoint>/api/prom/push
  mysqld_exporter:
    enabled: true
    instance: mysql-01
    data_source_name: "root:put-password-here@(localhost:3306)/"

Adding MySQL logs is just adding some extra lines of Grafana Agent config.yml:

yaml

metrics:
  wal_directory: /tmp/wal
logs:
  configs:
  - name: agent
    clients:
    - url: https://<cloud-logs-endpoint>/loki/api/v1/push
    positions:
      filename: /tmp/positions.yaml
    target_config:
      sync_period: 10s
    scrape_configs:
    - job_name: integrations/mysql 
      static_configs:
        - labels:
            instance: mysql-01
            job: integrations/mysql
            __path__: /var/log/mysql/*.log
      pipeline_stages:
        - regex:
            expression: '(?P<timestamp>.+) (?P<thread>[\d]+) \[(?P<label>.+?)\]( \[(?P<err_code>.+?)\] \[(?P<subsystem>.+?)\])? (?P<msg>.+)'
        - labels:
            label:
            err_code:
            subsystem:
        - drop:
            expression: "^ *$"
            drop_counter_reason: "drop empty lines"

integrations:
  prometheus_remote_write:
    - url: https://<cloud-endpoint>/api/prom/push
  mysqld_exporter:
    enabled: true
    instance: mysql-01
    data_source_name: "root:put-password-here@(localhost:3306)/"
    relabel_configs:
      - source_labels: [__address__]
        target_label: job
        replacement: 'integrations/mysql'

The additional configuration above locates and parses MySQL server logs by using an embedded Promtail Agent.

The most crucial configuration part is to make sure that the labels job and instance match each other for logs and metrics. This ensures that we can quickly dive from graphs to corresponding logs for more details on what actually happened.

You can find more information on configuring the MySQL integration in our MySQL integration documentation.

To learn more and get a better understanding of how to correlate metrics, logs, and traces in Grafana, I also recommend checking out the detailed talk by Andrej Ocenas on how to successfully correlate metrics, logs, and traces in Grafana.

Start monitoring with the MySQL logs dashboard

New logs dashboard in the My SQL integration for Grafana Cloud

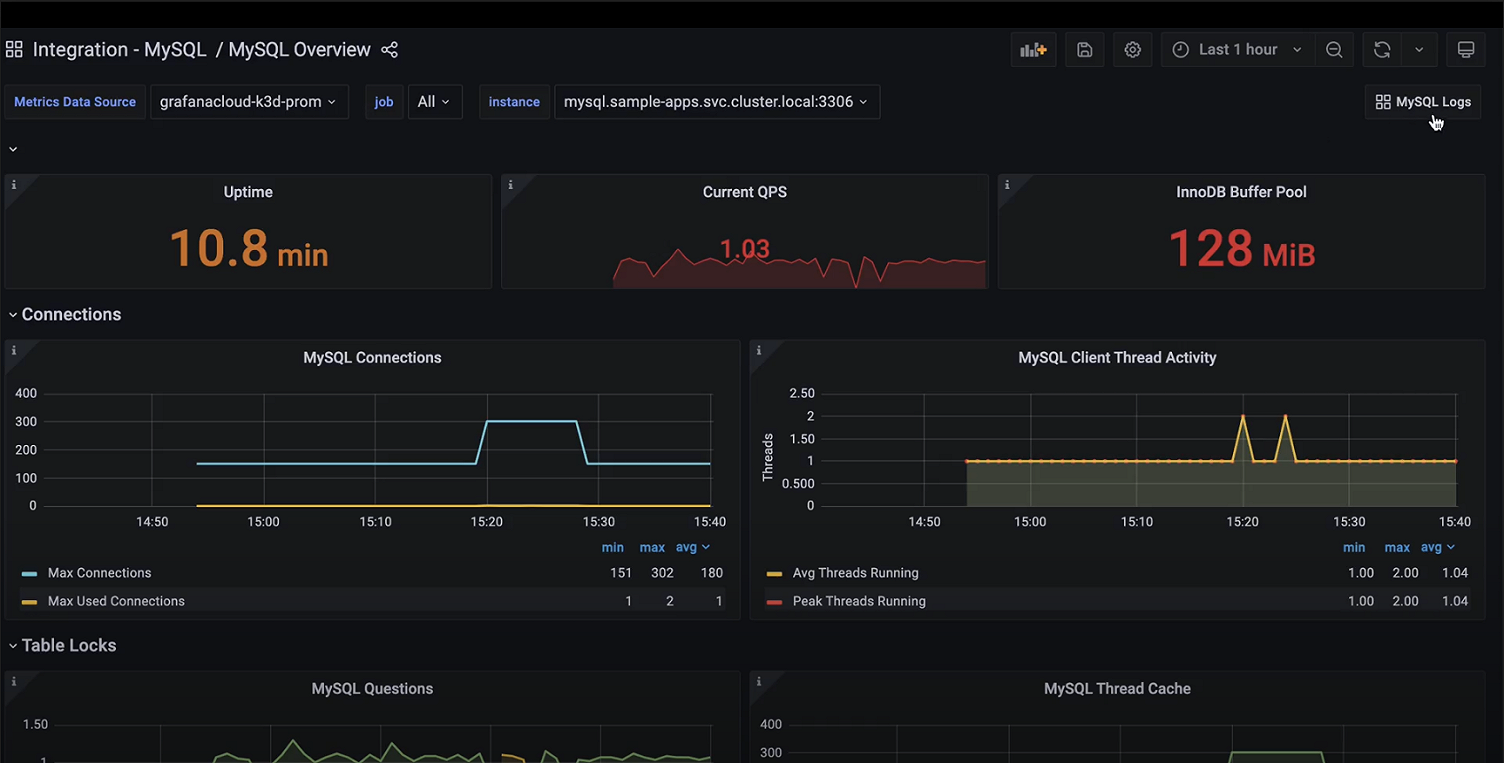
Along with coming packaged with pre-built dashboards as well as metrics and alerts, the MySQL integration for Grafana Cloud now bundles a new MySQL logs dashboard that can be quickly accessed from the MySQL overview dashboard when you need a deeper understanding of what’s going on with your MySQL server:

The important thing to note is that if you jump from one dashboard to another, the context of the MySQL instance and time interval will remain the same.

Try out the MySQL integration

The enhanced MySQL integration with log capabilities is available now for Grafana Cloud users. If you’re not already using Grafana Cloud, we have a generous free forever tier and plans for every use case. Sign up for free now!

It’s the easiest way to get started observing metrics, logs, traces, and dashboards.

For more information on monitoring and alerting on Grafana Cloud and MySQL, check out our MySQL integration documentation,  the MySQL solutions page, or join the #integrations channel in the Grafana Labs Community Slack.

關於Python 3虛擬環境(venv)

Python是一種流行的高級編程語言,廣泛用於Web開發、數據科學、人工智能等領域。為了保持Python的穩定性和可靠性,Python 3引入了venv(虛擬環境)的概念,這使得開發人員可以為每個Python應用程序建立獨立的環境,這些環境之間相互獨立,不會干擾彼此。

venv是Python 3的內置模塊,可以通過命令行創建和管理虛擬環境。下面我們將一步步介紹如何使用venv創建虛擬環境。

首先,打開命令行終端,進入你想要創建虛擬環境的目錄。然後運行以下命令:

“`
python3 -m venv myenv
“`

這個命令將在當前目錄中創建一個名為“myenv”的虛擬環境。你可以將“myenv”替換為你想要的任何名稱。

接下來,啟動虛擬環境。在命令行中運行以下命令:

– 在Windows中:

“`
myenv\Scripts\activate.bat
“`

– 在Mac或Linux中:

“`
source myenv/bin/activate
“`

這會激活虛擬環境,你將看到命令行前面出現了虛擬環境的名稱。

現在你可以安裝你需要的Python庫或模塊。在虛擬環境中運行以下命令:

“`
pip install <package_name>
“`

當你完成開發工作後,你可以退出虛擬環境。在命令行中運行以下命令:

“`
deactivate
“`

這將退出虛擬環境,你將回到原來的Python環境。

總之,venv是一個非常有用的工具,它可以幫助開發人員管理Python應用程序的依賴性並避免版本衝突。如果你還沒有使用venv,那麼現在是時候開始使用它了!

ESP32 vs ESP8266 – Pros and Cons

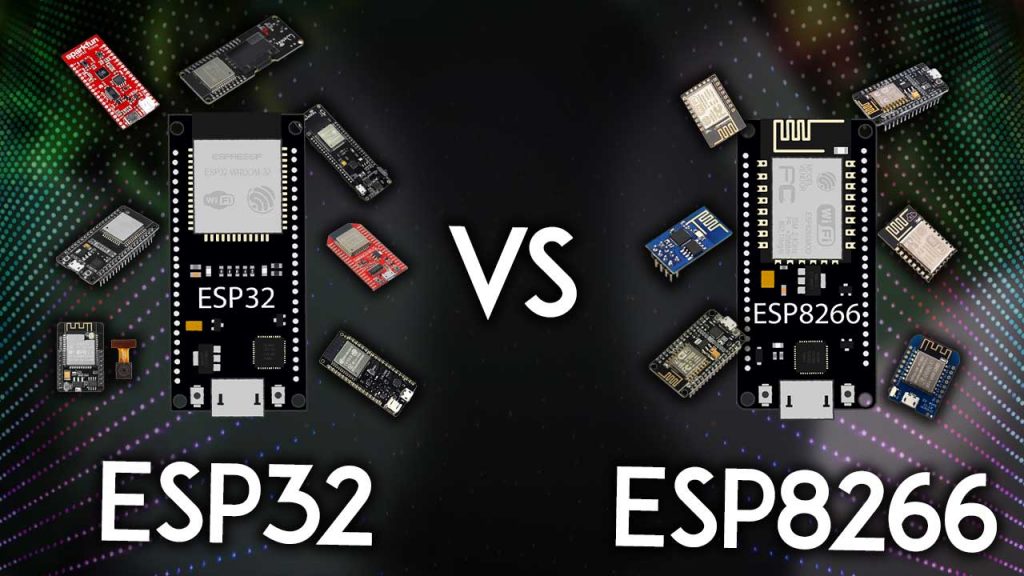
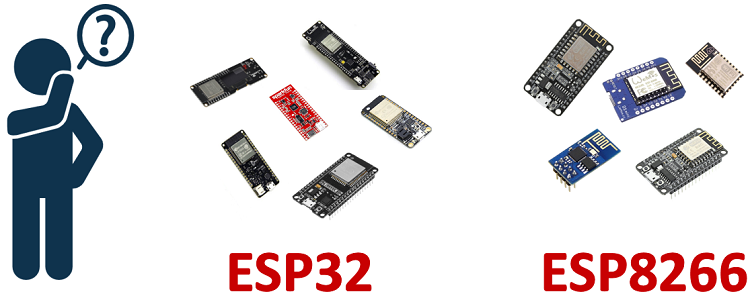
What’s the difference between ESP32 and ESP8266? Should you use the ESP32 or the ESP8266 in your projects? In this article, we’ll compare the ESP32 with the ESP8266 and cover the pros and cons of each board.

The ESP32 and ESP8266 are cheap Wi-Fi modules perfectly suited for DIY projects in the Internet of Things (IoT) and Home Automation fields.

Both chips have a 32-bit processor. The ESP32 is a dual-core 160MHz to 240MHz CPU, whereas the ESP8266 is a single-core processor that runs at 80MHz.

These modules come with GPIOs that support various protocols like SPI, I2C, UART, ADC, DAC, and PWM. The best part is that these boards come with wireless networking included, which makes them apart from other microcontrollers like the Arduino. This means that you can easily control and monitor devices remotely via Wi-Fi or Bluetooth (in the case of ESP32) for a very low price.

Alternatively, if you don’t need to use its wireless capabilities, you can use the ESP32/ESP8266 to control inputs and outputs as you would do with an Arduino. However, you should take into account that whereas the Arduino works with 5V logic, the ESP32 and ESP8266 work at 3.3V.

Specifications: ESP32 vs ESP8266

The ESP32 is the ESP8266 successor. It adds an extra CPU core, faster Wi-Fi, more GPIOs, and supports Bluetooth 4.2 and Bluetooth low energy. Additionally, the ESP32 comes with touch-sensitive pins that can be used to wake up the ESP32 from deep sleep, a built-in hall effect sensor, and a built-in temperature sensor (recent versions of the ESP32 don’t come with a built-in temperature sensor anymore).

Both boards are cheap, but the ESP32 costs slightly more. While the ESP32 can cost around $6 to $12, the ESP8266 can cost $4 to $6 (but it really depends on where you get them and what model you’re buying).

The following table shows the main differences between the ESP8266 and the ESP32 chips (table adapted from AMICA_IO).

ESP8266
ESP32
MCU
Xtensa Single-core 32-bit L106
Xtensa Dual-Core 32-bit LX6 with 600 DMIPS
802.11 b/g/n Wi-Fi
HT20
HT40
Bluetooth
X
Bluetooth 4.2 and BLE
Typical Frequency
80 MHz
160 MHz
SRAM
X
Flash
X
GPIO
17
34
Hardware /Software PWM
None / 8 channels
None / 16 channels
SPI/I2C/I2S/UART
2/1/2/2
4/2/2/2
ADC
10-bit
12-bit
CAN
X
Ethernet MAC Interface
X
Touch Sensor
X
Temperature Sensor
X
(old versions)
Hall effect sensor
X
Working Temperature
-40ºC to 125ºC
-40ºC to 125ºC
Price
$ (3$ – $6)
$$ ($6 – $12)
Where to buy

Using ESP32 or ESP8266 bare chips is not easy or practical, especially when testing and prototyping. Most of the time, you’ll want to use ESP32 and ESP8266 development boards. These boards come with all the needed circuitry to power the chip, connect it to your computer, a circuit to upload code easily, pins to connect peripherals, built-in power and control LEDs, and other useful features.

The ESP32 and ESP8266 development boards we use more often are the ESP32 DEVKIT DOIT Development board and the ESP8266 ESP-12E NodeMCU Kit and these are the ones we recommend for beginners. However, there are many other models of development boards that you can choose from. We recommend that you read the following guides:

More GPIOs on the ESP32

The ESP32 has more GPIOs than the ESP8266, and you can decide which pins are UART, I2CSPI—you need to set that on the code. This is possible due to the ESP32 chip’s multiplexing feature that allows you to assign multiple functions to the same pin.

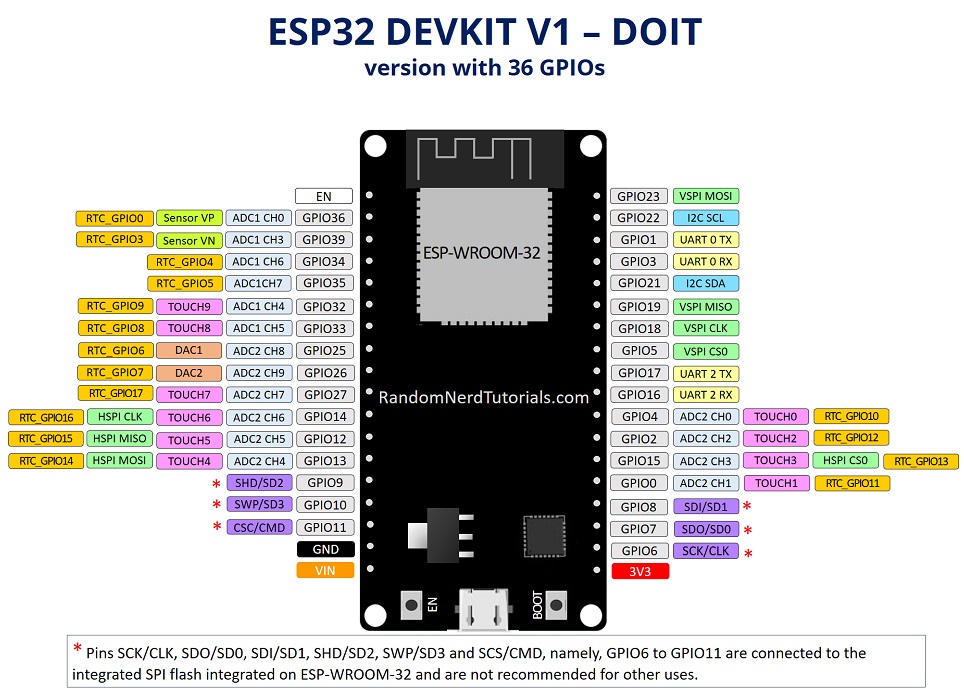
If you don’t set them on the code, they will be on the pins defined by default, as shown in the following figure (this is an example for the ESP32 DEVKIT V1 DOIT board (version with 36 GPIOS)—the pin location can change depending on the manufacturer).

To learn more about the ESP32 GPIOs and how to use them, read:

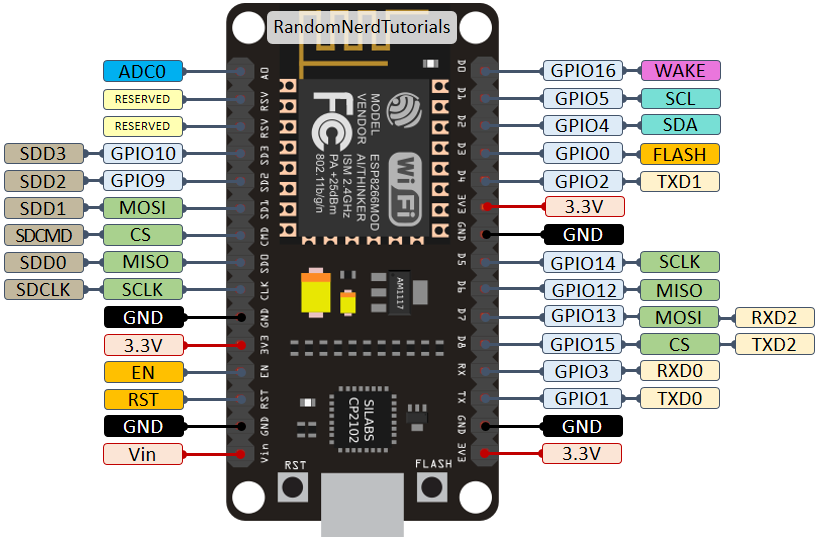
For means of comparison, here’s the pinout diagram for the ESP8266 ESP-12E NodeMCU Kit.

To learn more about the ESP8266 GPIOs and how to use them, read:

PWM, ADC, and More

You can set PWM signals in any GPIO with configurable frequencies and duty cycle set on the code.

When it comes to the analog pins, these are static, but the ESP32 supports measurements on 18 channels (analog-enabled pins) versus just one 10-bit ADC pin on the ESP8266. The ESP32 also supports two 8-bit DAC channels.

Moreover, the ESP32 contains 10 capacitive sensing GPIOs, that detect touch and can be used to trigger events, or wake-up the ESP32 from deep sleep, for example.

The ESP32 supports Bluetooth communication protocol by default, while the ESP8266 doesn’t.


Arduino IDE – ESP32 vs ESP8266

There are many ways to program the ESP32 and ESP8266 boards. Both boards can be programmed with the Arduino core using the Arduino IDE or other IDEs (like VS Code with the PlatformIO extension).

These are good news, especially for those used to program the Arduino board and are familiar with the Arduino “programming language”.

Getting started with the ESP32 or ESP8266 using Arduino IDE and have your first project running is very simple. You can follow these guides:

Although you can program both boards using Arduino IDE, they might not be compatible with the same libraries and functions. Some libraries are just compatible with one of the boards. This means that most of the time, your ESP8266 code will not be compatible with the ESP32. However, usually, you need to make a few modifications.

We have a dedicated list of free tutorials and projects for the ESP32 and ESP8266 boards using the Arduino IDE that you might found useful:

MicroPython Firwmare – ESP32 vs ESP8266

Another popular way of programming the ESP32 and ESP8266 boards is using MicroPython firmware.

MicroPython is a re-implementation of Python 3 targeted for microcontrollers and embedded systems. MicroPython is very similar with regular Python. So, if you already know how to program in Python, you also know how to program in MicroPython.

In MicroPython, most Python scripts are compatible with both boards (unlike when using Arduino IDE). This means that most of the time, you can use the same script for ESP32 and ESP8266.

You can get started with MicroPython firmware on the ESP32 and ESP8266 very quickly by following our free guides:

We also have a list of free projects using MicroPython with the ESP32 and ESP8266 boards:

Need Resources to Get Started?

If you want to get started with the ESP32 or ESP8266, you can take a look at our courses and projects:

ESP32 or ESP8266?

So, at this point you may be wondering: Should I get an ESP8266 or an ESP32?

It really depends on what you want to do. There is space for both boards, and both have pros and cons.

The ESP8266 is cheaper than the ESP32. Although it doesn’t have as many functionalities, it works just fine for most simple DIY IoT projects. However, it has some limitations in the GPIO mapping, and it might not have enough pins for what you intend to do. If that’s the case, you should get an ESP32.

The ESP32 is much more powerful than the ESP8266, comes with more GPIOs with multiple functions, faster Wi-Fi, and supports Bluetooth. However, many people think that the ESP32 is more difficult to deal with than the ESP8266 because it is more complex. On the contrary, in our opinion, it is as easy to program the ESP32 as the ESP8266, especially if you intend to program it using the “Arduino language” or MicroPython.

The ESP32 has some cons too. The ESP32 is more expensive than the ESP8266. So, if you’re building a simple IoT project, the ESP8266 might do the trick for a lower price. Additionally, because the ESP8266 is “older” than the ESP32, some libraries and features are better developed for the ESP8266, and you’ll find more resources (forums, people with the same issues, and how to solve them, etc.). However, as time goes by, the ESP32 is being widely adopted, and these differences in terms of development and libraries won’t be noticeable.

My personal experience: in 2021, I use almost exclusively the ESP32 for IoT projects. It is more versatile, and it comes with much more functionalities like Bluetooth, different wake-up sources, many peripherals, and much more. Additionally, the price difference is not a big deal, in my opinion. Once you move to the ESP32, you won’t want to go back to the ESP8266.

Wrapping Up

We hope you’ve found our analysis ESP32 vs ESP8266 useful.

Just to wrap up the main differences between the ESP32 and ESP8266:

  • The ESP32 is faster than the ESP8266;
  • The ESP32 comes with more GPIOs with multiple functions;
  • The ESP32 supports analog measurements on 18 channels (analog-enabled pins) versus just one 10-bit ADC pin on the ESP8266;
  • The ESP32 supports Bluetooth while the ESP8266 doesn’t;
  • The ESP32 is dual-core, and the ESP8266 is single core;
  • The ESP8266 is cheaper than the ESP32;
  • The ESP8266 has a wider community (although we don’t think that at this point, the difference is that relevant);
  • For many IoT and Wi-Fi projects, the ESP8266 can do the job for a lower price;
  • Both boards can be programmed with the Arduino core using Arduino IDE or other supported IDEs.
  • Both boards support MicroPython firmware.

You might like reading the following ESP8266 and ESP32 related articles to have an idea of the selection of the most popular ESP32 and ESP8266 development boards:

So, if you’re a beginner, should you get started with the ESP32 or the ESP8266? At this point, we definitely recommend getting started with the ESP32 instead of the ESP8266. However, if you already have an ESP8266 board, you can get started with that board and then make the shift to the ESP32.

We have a vast selection of projects with these boards in the Random Nerd Tutorials blog to help you get started:

Thanks for reading.

Analog JoyStick with Arduino

The Analog Joystick is similar to two potentiometers connected together, one for the vertical movement (Y-axis) and other for the horizontal movement (X-axis). The joystick also comes with a Select switch. It can be very handy for retro gaming, robot control or RC cars. So let’s understand how it works!dsc09428.jpg

Basics

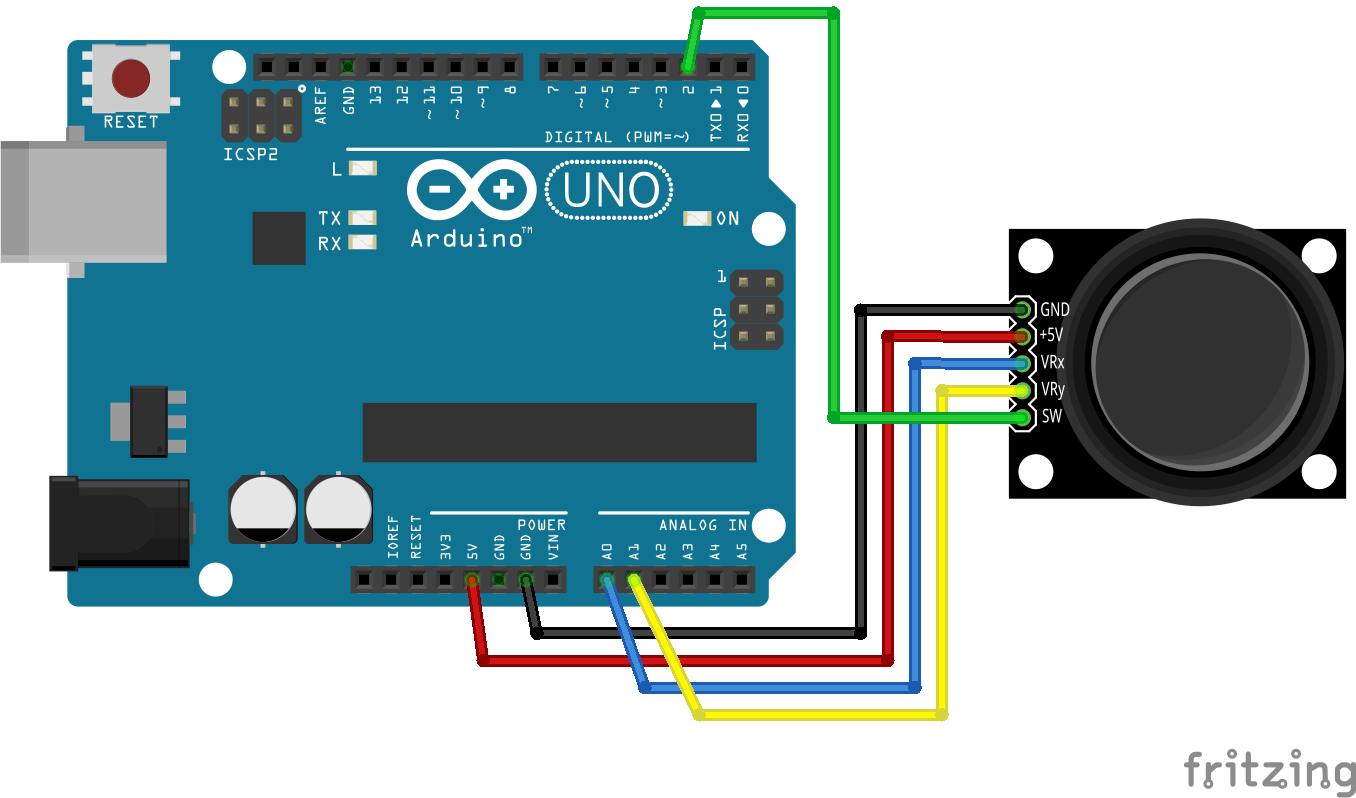
The Arduino Uno or any other Arduino board that uses Atmega328 as the Microcontroller has ADC resolution of 10 bits. Hence the values on each analog channel can vary from 0 to 1023. Now connecting the VRx to A0 and VRy to A1 analog inputs respectively should show values as shown in the image below.

Joy diagram.jpeg

The home position for the stick is at ( x,y:511,511). If the stick is moved on X axis from one end to the other, the X values will change from 0 to 1023 and similar thing happens when moved along the Y axis. On the same lines you can read position of the stick anywhere in upper half hemisphere from combination of these values.

Hookup

0 Joystick with Arduino bb.png

So let’s print the values on the terminal so that we can verify the working!

Raw Sketch

  1. #define joyX A0
  2. #define joyY A1
  3.  
  4. void setup() {
  5. Serial.begin(9600);
  6. }
  7.  
  8. void loop() {
  9. // put your main code here, to run repeatedly:
  10. xValue = analogRead(joyX);
  11. yValue = analogRead(joyY);
  12.  
  13. //print the values with to plot or view
  14. Serial.print(xValue);
  15. Serial.print(\t);
  16. Serial.println(yValue);
  17. }

Mapping

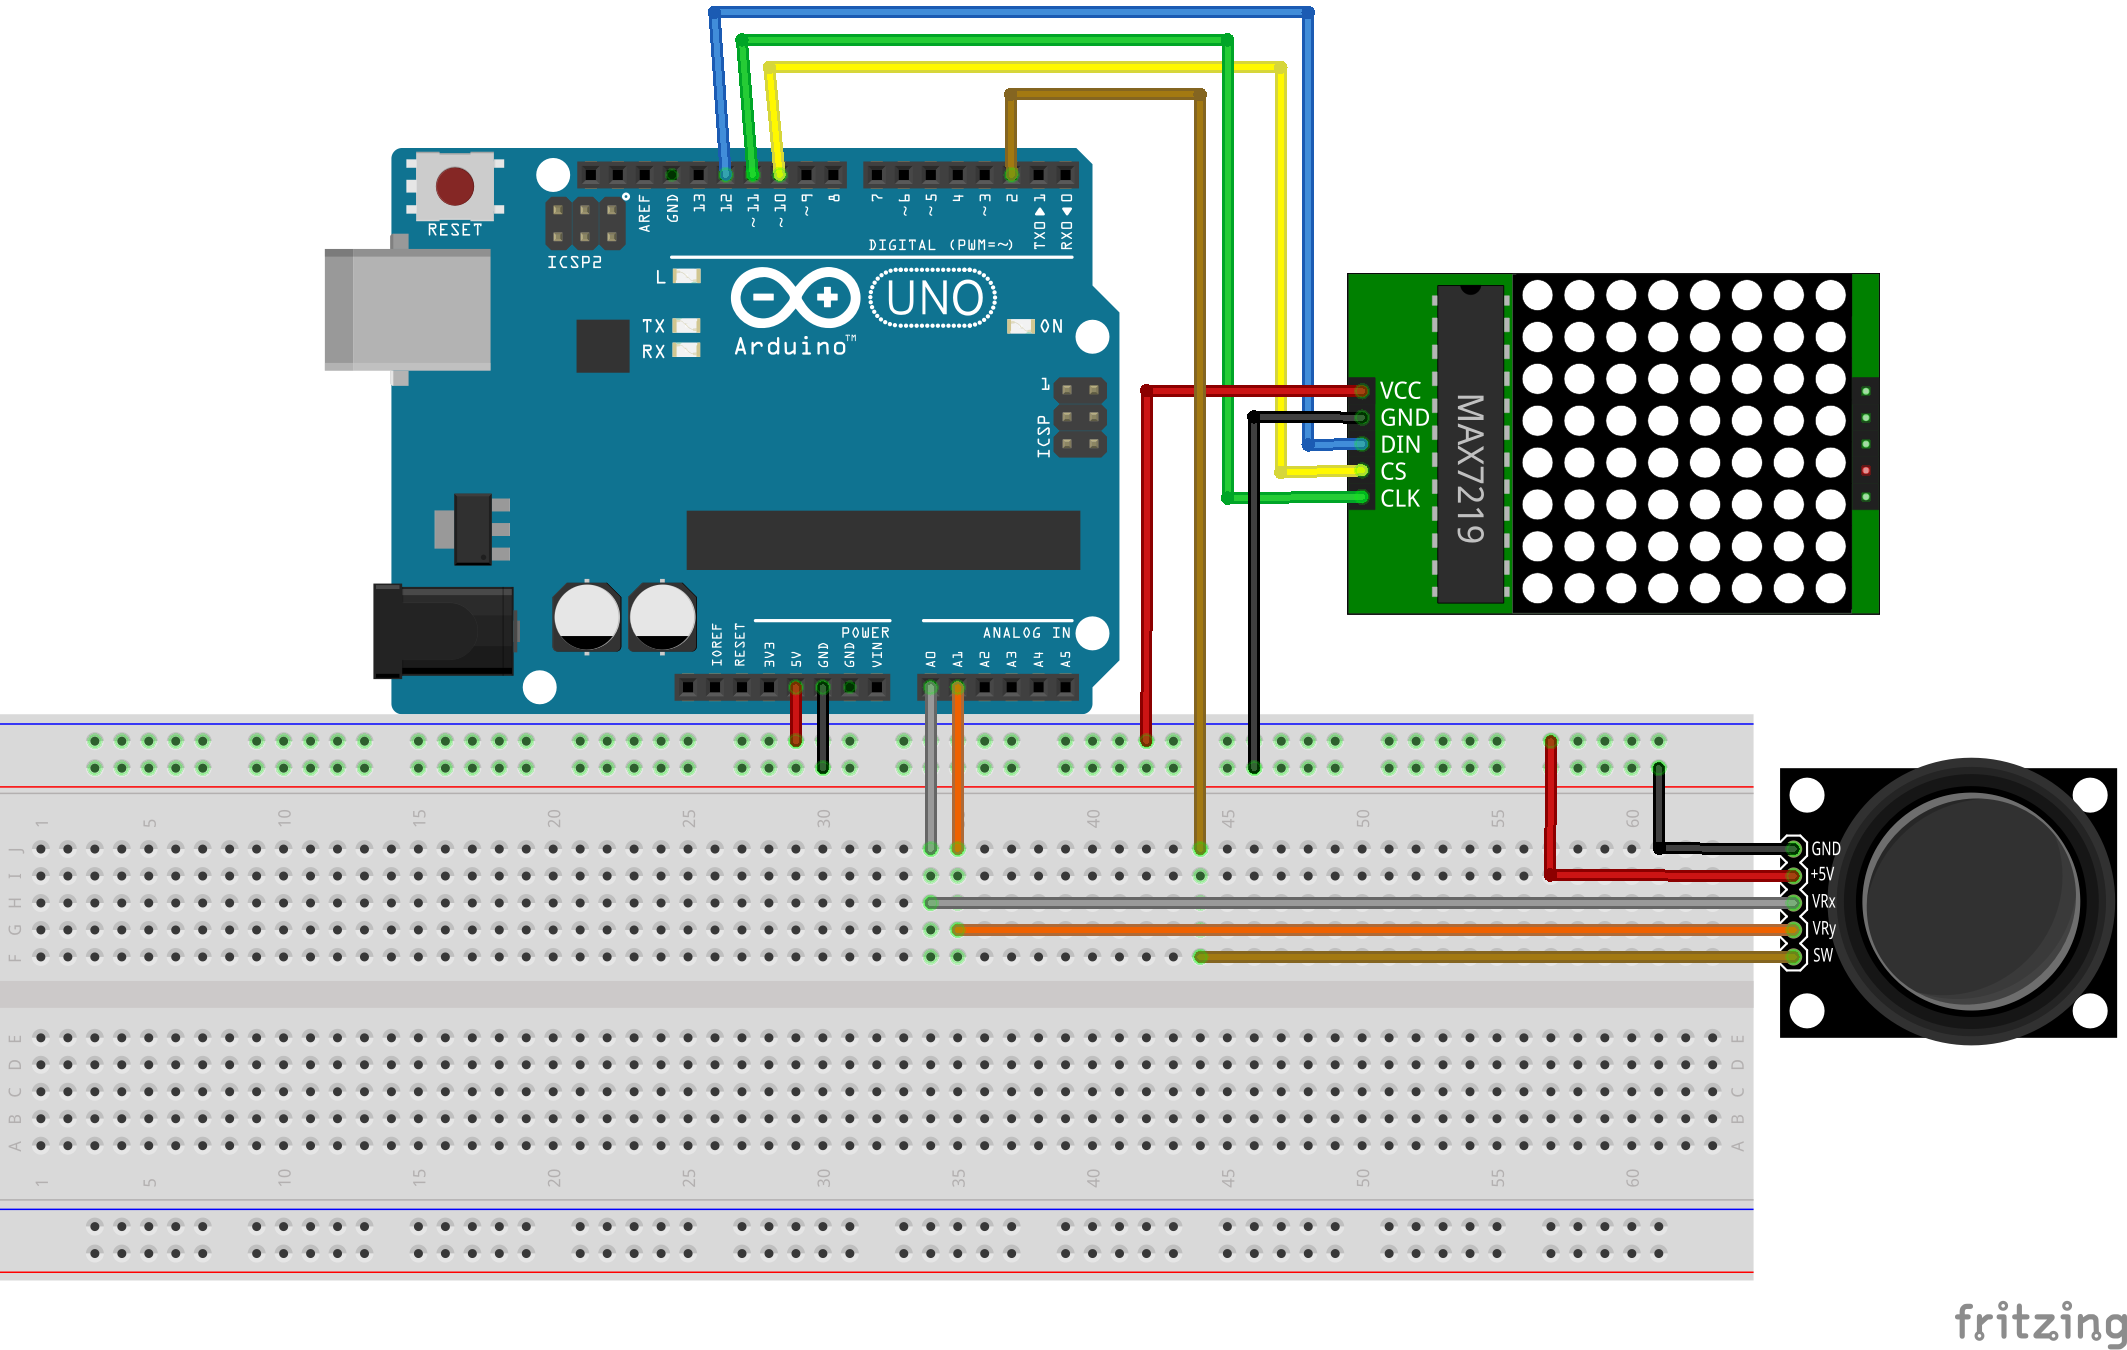
It is usually not enough to read the analog values, you might want to map it to a display or any other interface. So let’s map these these values to a 8×8 led matrix. So that we can move the pixel with the joystick. You can easily change this to map to a graphic or a OLED display.Matrx LED and Joystick with Arduino bb.png

  1. #include “LedControl.h”
  2. #define joyX A0
  3. #define joyY A1
  4.  
  5. int xMap, yMap, xValue, yValue;
  6. LedControl lc=LedControl(12,11,10,1);
  7.  
  8. void setup() {
  9. Serial.begin(115200);
  10.  
  11. lc.shutdown(0,false);
  12. /* Set the brightness to a medium values */
  13. lc.setIntensity(0,8);
  14. /* and clear the display */
  15. lc.clearDisplay(0);
  16. }
  17.  
  18. void loop() {
  19. // put your main code here, to run repeatedly:
  20. xValue = analogRead(joyX);
  21. yValue = analogRead(joyY);
  22. xMap = map(xValue, 0,1023, 0, 7);
  23. yMap = map(yValue,0,1023,7,0);
  24. lc.setLed(0,xMap,yMap,true);
  25. lc.clearDisplay(0);
  26.  
  27. }

So as you see in the code above, the map() function can be used to map the ranges as you wish. Also notice that the Y axis map is inverted! So much to learn with a simple interface! Do checkout the retro ping-pong game built with the same setup.


int VRx = A0;
int VRy = A1;
int SW = 2;

int xPosition = 0;
int yPosition = 0;
int SW_state = 0;
int mapX = 0;
int mapY = 0;

void setup() {
  Serial.begin(9600); 
  
  pinMode(VRx, INPUT);
  pinMode(VRy, INPUT);
  pinMode(SW, INPUT_PULLUP); 
  
}

void loop() {
  xPosition = analogRead(VRx);
  yPosition = analogRead(VRy);
  SW_state = digitalRead(SW);
  mapX = map(xPosition, 0, 1023, -512, 512);
  mapY = map(yPosition, 0, 1023, -512, 512);
  
  Serial.print("X: ");
  Serial.print(mapX);
  Serial.print(" | Y: ");
  Serial.print(mapY);
  Serial.print(" | Button: ");
  Serial.println(SW_state);

  delay(100);
  
}

Mac 安裝Secp256k1 no secp256k1 in java.library.path

報錯

#報錯提示
no secp256k1 in java.library.path

解決方案

  1. 使用 brew 安裝構建依賴項
    brew install autoconf automake libtool berkeley-db4 pkg-config openssl boost boost-build libevent
  2. 下載secp256k1
    #隨便找個地方clone就行
    git clone [email protected]:bitcoin-core/secp256k1.git
  3. 構建secp256k1
    #以下步驟都在clone的secp256k1 中進行
    1. sh autogen.sh 
    #這一步與github 中的不同,github 的還是會出錯,視情況輸入命令吧
    2. ./configure --enable-module-recovery --enable-jni --enable-module-ecdh --enable-experimental
    3. make 
    4. make check 
    5. sudo make install
    6.

參考資料

DBeaver Ultimate 22.1 旗舰版激活方法

本站惯例:本文假定你知道DBeaver。不知道可以问问搜索引擎。

DBeaver是一款优秀的数据库管理工具,支持管理众多数据库产品,巴拉巴拉。

DBeaver Ultimate(简称DBeaverUE)支持MongoDBRedisApache Hive等,对比于DBeaver Enterprise多了连接云服务器的功能,但是需要付费使用。

这次要送的这份礼就是: DBeaverUE 22.1.0及以下版本(理论上适用于目前所有新老版本)的破解,可使用它来激活你手头上的DBeaverUE。

下载地址:
百度云下载(download link),提取码:hvx1
OneDrive(download link)

具体使用方法已写在压缩包的README.txt内,有什么问题可以给我提Issue或进QQ群:30347511讨论。

按照README.txt配置好之后,使用DBeaverUE专用激活码:

1
2
3
4
5
aYhAFjjtp3uQZmeLzF3S4H6eTbOgmru0jxYErPCvgmkhkn0D8N2yY6ULK8oT3fnpoEu7GPny7csN
sXL1g+D+8xR++/L8ePsVLUj4du5AMZORr2xGaGKG2rXa3NEoIiEAHSp4a6cQgMMbIspeOy7dYWX6
99Fhtpnu1YBoTmoJPaHBuwHDiOQQk5nXCPflrhA7lldA8TZ3dSUsj4Sr8CqBQeS+2E32xwSniymK
7fKcVX75qnuxhn7vUY7YL2UY7EKeN/AZ+1NIB6umKUODyOAFIc8q6zZT8b9aXqXVzwLJZxHbEgcO
8lsQfyvqUgqD6clzvFry9+JwuQsXN0wW26KDQA==

DBeaverUE有几点需要注意的:

  • windows 系统请使用ZIP包,下载链接:x64
  • mac 系统请使用DMG包,下载链接:intel / m1
  • linux 系统请使用.TAR.GZ包,下载链接:x64
  • DBeaver运行需要java,请自行安装!
  • 不要使用DBeaver自带的jre,它被人为阉割了。

22.1版本请在dbeaver.ini文件末尾添加一行:-Dlm.debug.mode=true

请自行安装jdk11,替换dbeaver.ini内由-vm指定的java路径,把地址换成自己安装的!

如果你的dbeaver.ini内没有-vm参数,请在首行添加你安装jdk的java路径:

1
2
-vm 
/path/to/your/bin/java

下面是国际惯例:

本项目只做个人学习研究之用,不得用于商业用途!

若资金允许,请购买正版,谢谢合作!

Spring Boot Admin的介绍及使用

Spring Boot 有一个非常好用的监控和管理的源软件,这个软件就是 Spring Boot Admin。该软件能够将 Actuator 中的信息进行界面化的展示,也可以监控所有 Spring Boot 应用的健康状况,提供实时警报功能。

主要的功能点有:

  • 显示应用程序的监控状态
  • 应用程序上下线监控
  • 查看 JVM,线程信息
  • 可视化的查看日志以及下载日志文件
  • 动态切换日志级别
  • Http 请求信息跟踪
  • 其他功能点……

可点击 https://github.com/codecentric/spring-boot-admin 更多了解 Spring-boot-admin。

创建Spring Boot Admin项目

创建一个 Spring Boot 项目,用于展示各个服务中的监控信息,加上 Spring Boot Admin 的依赖,具体代码如下所示。

<dependency>
<groupId>org.springframework.boot</groupId>
<artifactId>spring-boot-starter-web</artifactId>
</dependency>
<dependency>
<groupId>de.codecentric</groupId>
<artifactId>spring-boot-admin-starter-server</artifactId>
<version>2.0.2</version>
</dependency>

创建一个启动类,具体代码如下所示。

  1. @EnableAdminServer
  2. @SpringBootApplication
  3. public class App {
  4. public static void main(String[] args) {
  5. SpringApplication.run(App.class, args);
  6. }
  7. }

在属性文件中增加端口配置信息:

server.port=9091

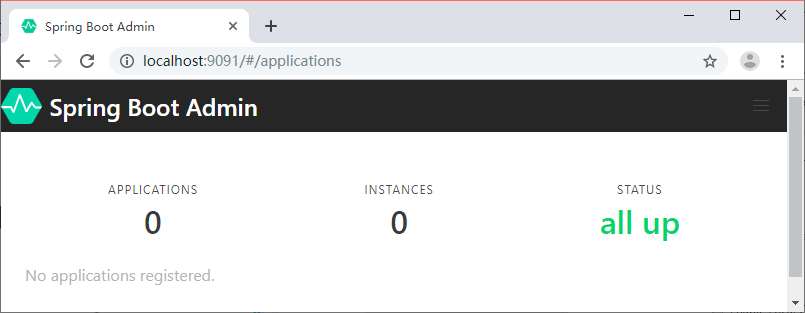
启动程序,访问 Web 地址 http://localhost:9091 就可以看到主页面了,这个时候是没有数据的,如图 1 所示。

Spring Boot Admin主页
图 1  Spring Boot Admin主页

将服务注册到 Spring Boot Admin

创建一个 Spring Boot 项目,名称为 spring-boot-admin-client。添加 Spring Boot Admin Client 的 Maven 依赖,代码如下所示。

<dependency>
<groupId>de.codecentric</groupId>
<artifactId>spring-boot-admin-starter-client</artifactId>
<version>2.0.2</version>
</dependency>

然后在属性文件中添加下面的配置:

server.port=9092
spring.boot.admin.client.url=http://localhost:9091

spring.boot.admin.client.url:Spring Boot Admin 服务端地址。

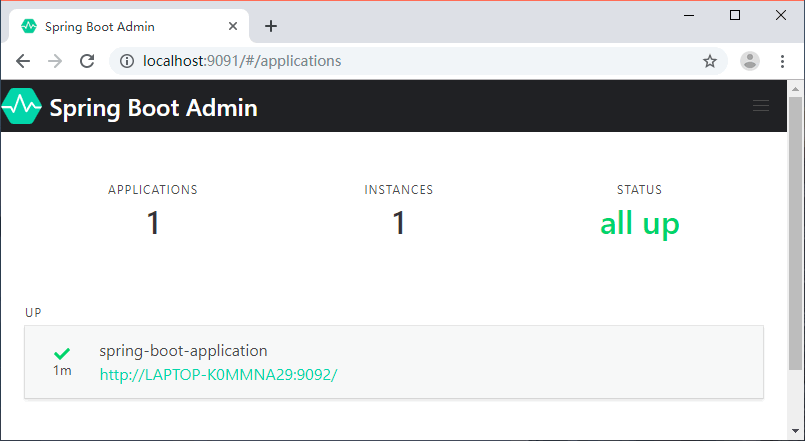
将服务注册到 Admin 之后我们就可以在 Admin 的 Web 页面中看到我们注册的服务信息了,如图 2 所示。

Spring Boot Admin主页(有数据)
图 2  Spring Boot Admin主页(有数据)

点击实例信息跳转到详细页面,可以查看更多的信息,如图 3 所示。

Spring Boot Admin详情
图 3  Spring Boot Admin详情

可以看到详情页面并没有展示丰富的监控数据,这是因为没有将 spring-boot-admin-client 的端点数据暴露出来。

在 spring-boot-admin-client 中加入 actuator 的 Maven 依赖,代码如下所示。

<dependency>
<groupId>org.springframework.boot</groupId>
<artifactId>spring-boot-starter-actuator</artifactId>
</dependency>

然后在属性文件中追加下面的配置:

management.endpoints.web.exposure.include=*

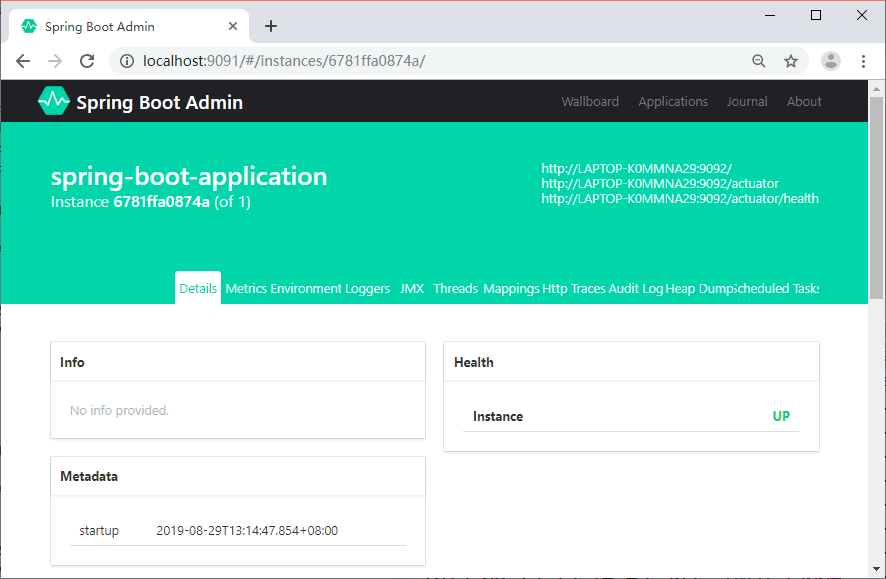
management.endpoints.web.exposure.include:暴露所有的 actuator 端点信息重启 spring-boot-admin-client,我们就可以在详情页面看到更多的数据,如图 4 所示。

Spring Boot Admin详情(有数据)
图 4  Spring Boot Admin详情(有数据)

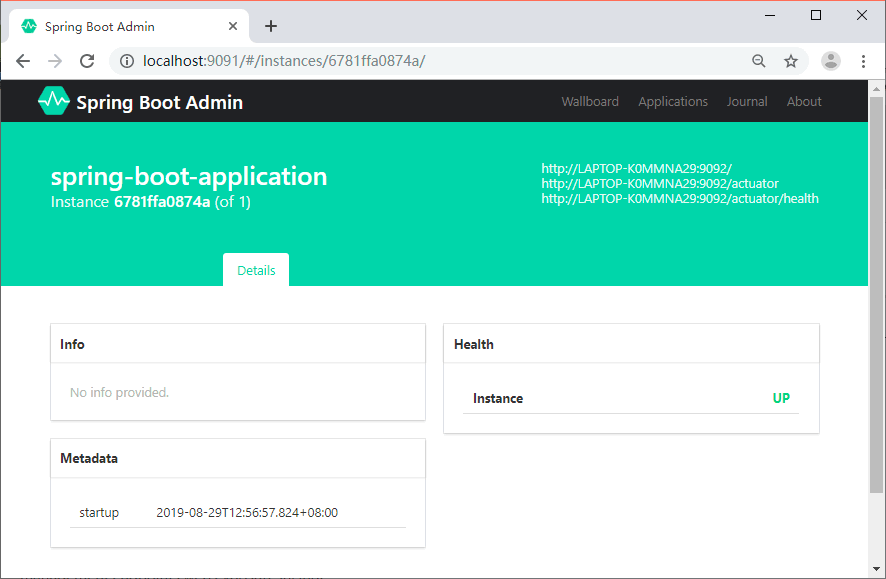
监控内容介绍

自定义的 Info 信息、健康状态、元数据,如图 5 所示。

Spring Boot Admin数据展示(一)
图 5  Spring Boot Admin数据展示(一)

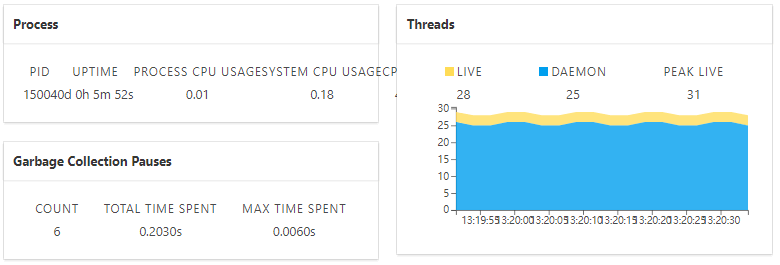
CPU、线程等信息如图 6 所示。

Spring Boot Admin数据展示(二)
图 6  Spring Boot Admin数据展示(二)

内存使用情况如图 7 所示。

Spring Boot Admin数据展示(三)
图 7  Spring Boot Admin数据展示(三)

配置信息如图 8 所示。

Spring Boot Admin数据展示(四)
图 8  Spring Boot Admin数据展示(四)

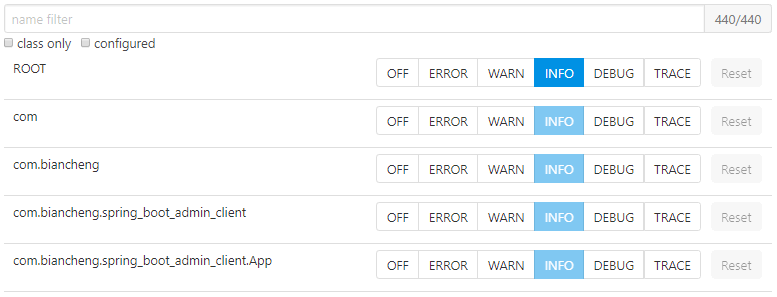
日志级别调整如图 9 所示。

Spring Boot Admin数据展示(五)
图 9  Spring Boot Admin数据展示(五)

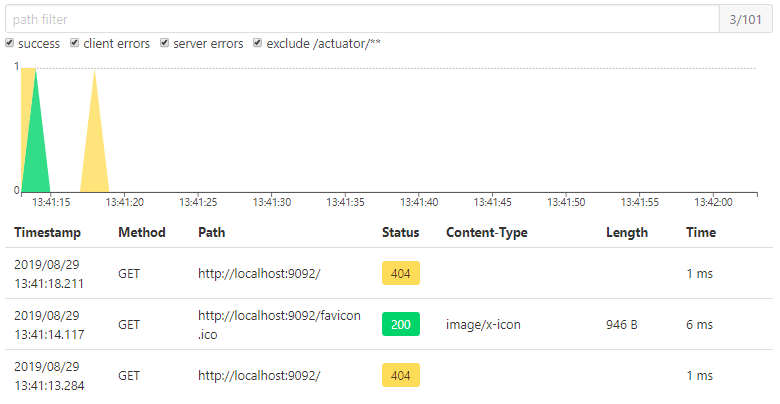
Http请求信息如图 10 所示。

Spring Boot Admin数据展示(六)
图 10  Spring Boot Admin数据展示(六)

如何在Admin中查看各个服务的日志

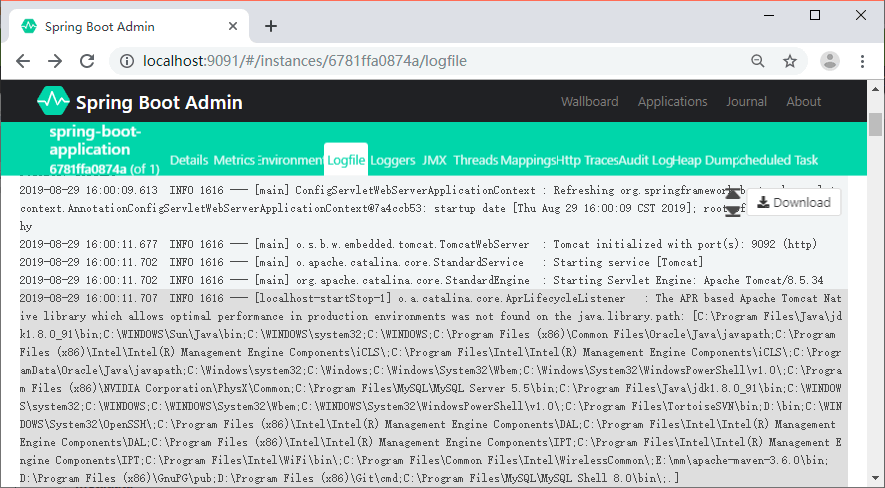
Spring Boot Admin 提供了基于 Web 页面的方式实时查看服务输出的本地日志,前提是服务中配置了 logging.file。

我们在 spring-boot-admin-client 的属性文件中增加下面的内容:

logging.file=/Users/zhangsan/Downloads/spring-boot-admin-client.log

重启服务,就可以在 Admin Server 的 Web 页面中看到新加了一个 Logfile 菜单,如图 11 所示。

Spring Boot Admin日志
图 11  Spring Boot Admin 日志

Docker Dockerfile

什么是 Dockerfile?
Dockerfile 是一个用来构建镜像的文本文件,文本内容包含了一条条构建镜像所需的指令和说明。

使用 Dockerfile 定制镜像
这里仅讲解如何运行 Dockerfile 文件来定制一个镜像,具体 Dockerfile 文件内指令详解,将在下一节中介绍,这里你只要知道构建的流程即可。

1、下面以定制一个 nginx 镜像(构建好的镜像内会有一个 /usr/share/nginx/html/index.html 文件)

在一个空目录下,新建一个名为 Dockerfile 文件,并在文件内添加以下内容:

FROM nginx
RUN echo ‘这是一个本地构建的nginx镜像’ > /usr/share/nginx/html/index.html

2、FROM 和 RUN 指令的作用

FROM:定制的镜像都是基于 FROM 的镜像,这里的 nginx 就是定制需要的基础镜像。后续的操作都是基于 nginx。

RUN:用于执行后面跟着的命令行命令。有以下俩种格式:

shell 格式:

RUN <命令行命令>
# <命令行命令> 等同于,在终端操作的 shell 命令。
exec 格式:

RUN [“可执行文件”, “参数1”, “参数2”]
# 例如:
# RUN [“./test.php”, “dev”, “offline”] 等价于 RUN ./test.php dev offline
注意:Dockerfile 的指令每执行一次都会在 docker 上新建一层。所以过多无意义的层,会造成镜像膨胀过大。例如:

FROM centos
RUN yum -y install wget
RUN wget -O redis.tar.gz “http://download.redis.io/releases/redis-5.0.3.tar.gz”
RUN tar -xvf redis.tar.gz
以上执行会创建 3 层镜像。可简化为以下格式:

FROM centos
RUN yum -y install wget \
&& wget -O redis.tar.gz “http://download.redis.io/releases/redis-5.0.3.tar.gz” \
&& tar -xvf redis.tar.gz
如上,以 && 符号连接命令,这样执行后,只会创建 1 层镜像。

开始构建镜像
在 Dockerfile 文件的存放目录下,执行构建动作。

以下示例,通过目录下的 Dockerfile 构建一个 nginx:v3(镜像名称:镜像标签)。

注:最后的 . 代表本次执行的上下文路径,下一节会介绍。

$ docker build -t nginx:v3 .

以上显示,说明已经构建成功。

上下文路径
上一节中,有提到指令最后一个 . 是上下文路径,那么什么是上下文路径呢?

$ docker build -t nginx:v3 .
上下文路径,是指 docker 在构建镜像,有时候想要使用到本机的文件(比如复制),docker build 命令得知这个路径后,会将路径下的所有内容打包。

解析:由于 docker 的运行模式是 C/S。我们本机是 C,docker 引擎是 S。实际的构建过程是在 docker 引擎下完成的,所以这个时候无法用到我们本机的文件。这就需要把我们本机的指定目录下的文件一起打包提供给 docker 引擎使用。

如果未说明最后一个参数,那么默认上下文路径就是 Dockerfile 所在的位置。

注意:上下文路径下不要放无用的文件,因为会一起打包发送给 docker 引擎,如果文件过多会造成过程缓慢。

指令详解
COPY
复制指令,从上下文目录中复制文件或者目录到容器里指定路径。

格式:

COPY [–chown=:] <源路径1>… <目标路径>
COPY [–chown=:] [“<源路径1>”,… “<目标路径>”]
[–chown=:]:可选参数,用户改变复制到容器内文件的拥有者和属组。

<源路径>:源文件或者源目录,这里可以是通配符表达式,其通配符规则要满足 Go 的 filepath.Match 规则。例如:

COPY hom* /mydir/
COPY hom?.txt /mydir/
<目标路径>:容器内的指定路径,该路径不用事先建好,路径不存在的话,会自动创建。

ADD
ADD 指令和 COPY 的使用格类似(同样需求下,官方推荐使用 COPY)。功能也类似,不同之处如下:

ADD 的优点:在执行 <源文件> 为 tar 压缩文件的话,压缩格式为 gzip, bzip2 以及 xz 的情况下,会自动复制并解压到 <目标路径>。
ADD 的缺点:在不解压的前提下,无法复制 tar 压缩文件。会令镜像构建缓存失效,从而可能会令镜像构建变得比较缓慢。具体是否使用,可以根据是否需要自动解压来决定。
CMD
类似于 RUN 指令,用于运行程序,但二者运行的时间点不同:

CMD 在docker run 时运行。
RUN 是在 docker build。
作用:为启动的容器指定默认要运行的程序,程序运行结束,容器也就结束。CMD 指令指定的程序可被 docker run 命令行参数中指定要运行的程序所覆盖。

注意:如果 Dockerfile 中如果存在多个 CMD 指令,仅最后一个生效。

格式:

CMD
CMD [“<可执行文件或命令>”,””,””,…]
CMD [“”,””,…] # 该写法是为 ENTRYPOINT 指令指定的程序提供默认参数
推荐使用第二种格式,执行过程比较明确。第一种格式实际上在运行的过程中也会自动转换成第二种格式运行,并且默认可执行文件是 sh。

ENTRYPOINT
类似于 CMD 指令,但其不会被 docker run 的命令行参数指定的指令所覆盖,而且这些命令行参数会被当作参数送给 ENTRYPOINT 指令指定的程序。

但是, 如果运行 docker run 时使用了 –entrypoint 选项,将覆盖 ENTRYPOINT 指令指定的程序。

优点:在执行 docker run 的时候可以指定 ENTRYPOINT 运行所需的参数。

注意:如果 Dockerfile 中如果存在多个 ENTRYPOINT 指令,仅最后一个生效。

格式:

ENTRYPOINT [“”,””,””,…]
可以搭配 CMD 命令使用:一般是变参才会使用 CMD ,这里的 CMD 等于是在给 ENTRYPOINT 传参,以下示例会提到。

示例:

假设已通过 Dockerfile 构建了 nginx:test 镜像:

FROM nginx

ENTRYPOINT [“nginx”, “-c”] # 定参
CMD [“/etc/nginx/nginx.conf”] # 变参
1、不传参运行

$ docker run nginx:test
容器内会默认运行以下命令,启动主进程。

nginx -c /etc/nginx/nginx.conf
2、传参运行

$ docker run nginx:test -c /etc/nginx/new.conf
容器内会默认运行以下命令,启动主进程(/etc/nginx/new.conf:假设容器内已有此文件)

nginx -c /etc/nginx/new.conf
ENV
设置环境变量,定义了环境变量,那么在后续的指令中,就可以使用这个环境变量。

格式:

ENV
ENV = =…
以下示例设置 NODE_VERSION = 7.2.0 , 在后续的指令中可以通过 $NODE_VERSION 引用:

ENV NODE_VERSION 7.2.0

RUN curl -SLO “https://nodejs.org/dist/v$NODE_VERSION/node-v$NODE_VERSION-linux-x64.tar.xz” \
&& curl -SLO “https://nodejs.org/dist/v$NODE_VERSION/SHASUMS256.txt.asc”
ARG
构建参数,与 ENV 作用一致。不过作用域不一样。ARG 设置的环境变量仅对 Dockerfile 内有效,也就是说只有 docker build 的过程中有效,构建好的镜像内不存在此环境变量。

构建命令 docker build 中可以用 –build-arg <参数名>=<值> 来覆盖。

格式:

ARG <参数名>[=<默认值>]
VOLUME
定义匿名数据卷。在启动容器时忘记挂载数据卷,会自动挂载到匿名卷。

作用:

避免重要的数据,因容器重启而丢失,这是非常致命的。
避免容器不断变大。
格式:

VOLUME [“<路径1>”, “<路径2>”…]
VOLUME <路径>
在启动容器 docker run 的时候,我们可以通过 -v 参数修改挂载点。

EXPOSE
仅仅只是声明端口。

作用:

帮助镜像使用者理解这个镜像服务的守护端口,以方便配置映射。
在运行时使用随机端口映射时,也就是 docker run -P 时,会自动随机映射 EXPOSE 的端口。
格式:

EXPOSE <端口1> [<端口2>…]
WORKDIR
指定工作目录。用 WORKDIR 指定的工作目录,会在构建镜像的每一层中都存在。(WORKDIR 指定的工作目录,必须是提前创建好的)。

docker build 构建镜像过程中的,每一个 RUN 命令都是新建的一层。只有通过 WORKDIR 创建的目录才会一直存在。

格式:

WORKDIR <工作目录路径>
USER
用于指定执行后续命令的用户和用户组,这边只是切换后续命令执行的用户(用户和用户组必须提前已经存在)。

格式:

USER <用户名>[:<用户组>]
HEALTHCHECK
用于指定某个程序或者指令来监控 docker 容器服务的运行状态。

格式:

HEALTHCHECK [选项] CMD <命令>:设置检查容器健康状况的命令
HEALTHCHECK NONE:如果基础镜像有健康检查指令,使用这行可以屏蔽掉其健康检查指令

HEALTHCHECK [选项] CMD <命令> : 这边 CMD 后面跟随的命令使用,可以参考 CMD 的用法。
ONBUILD
用于延迟构建命令的执行。简单的说,就是 Dockerfile 里用 ONBUILD 指定的命令,在本次构建镜像的过程中不会执行(假设镜像为 test-build)。当有新的 Dockerfile 使用了之前构建的镜像 FROM test-build ,这时执行新镜像的 Dockerfile 构建时候,会执行 test-build 的 Dockerfile 里的 ONBUILD 指定的命令。

格式:

ONBUILD <其它指令>
LABEL
LABEL 指令用来给镜像添加一些元数据(metadata),以键值对的形式,语法格式如下:

LABEL = = = …
比如我们可以添加镜像的作者:

LABEL org.opencontainers.image.authors=”StrongYuen”

OpenWRT下安装和配置shadowsocks

本文主要记录在openWRT下安装和配置shadowsocks的简要过程,便于日后查找和备忘。成功安装后可以实现透明代理,分流和防DNS污染。

Environment

  • 路由器型号:YouHua WR1200JS
  • 固件版本:OpenWrt 19.07.4 r11208-ce6496d796 / LuCI openwrt-19.07 branch git-21.054.03371-3b137b5

拓扑图+工作原理

topology map

  1. dnsmasq是openwrt自带的一个软件,提供dns缓存,dhcp等功能。dnsmasq会将dns查询数据包转发给chinadns。
  2. chinadns的上游DNS服务器有两个,一个是国内DNS,一个是可信DNS(国外DNS)。
    • chinadns会同时向上游的DNS发送请求
    • 如果可信DNS先返回, 则直接采用可信DNS的结果
    • 如果国内DNS先返回, 分两种情况: 如果返回的结果是国内IP,则采用;否则丢弃并等待采用可信DNS的结果

3.dns-forwarder 支持DNS TCP查询, 如果ISP的UDP不稳定, 丢包严重,可以使用dns-forwarder来代替ss-tunnel来进行DNS查询.

4.shadowsocks 用于转发数据包, 科学上网. 关于shadowsocks的科普文章可查看这里: https://www.css3er.com/p/107.html

相关的ipk软件包下载地址

ipk软件包集合, 不同的CPU架构需要使用不同的软件包, CPU架构是mipsel_24kc的话, 可以集中从这里下载.
链接: https://pan.baidu.com/s/14QDoTLqw-SEBZvQVQeVgvA 提取码: ugsc
其它的CPU架构, 可以去GitHub主页 -> Releases下载别人已经编译好的软件包, 如果没有, 只能自己下载openWRT的SDK, 自己进行编译.

  • shadowsocks-libev_3.3.5-1_mipsel_24kc.ipk
  • shadowsocks-libev-server_3.3.5-1_mipsel_24kc.ipk
  • ChinaDNS_1.3.3-1_mipsel_24kc.ipk
  • dns-forwarder_1.2.1-2_mipsel_24kc.ipk
  • luci-compat
  • luci-app-shadowsocks-without-ipset_1.9.1-1_all.ipk
  • luci-app-chinadns_1.6.2-1_all.ipk
  • luci-app-dns-forwarder_1.6.2-1_all.ipk

链接: https://pan.baidu.com/s/14QDoTLqw-SEBZvQVQeVgvA 提取码: ugsc

openwrt-shadowsocks

GitHubhttps://github.com/shadowsocks/openwrt-shadowsocks
luci-app-shadowsockshttps://github.com/shadowsocks/luci-app-shadowsocks

  • shadowsocks-libev
     客户端/
     └── usr/
         └── bin/
             ├── ss-local       // 提供 SOCKS 正向代理, 在透明代理工作模式下用不到这个.
             ├── ss-redir       // 提供透明代理, 从 v2.2.0 开始支持 UDP
             └── ss-tunnel      // 提供端口转发, 可用于 DNS 查询
    
  • shadowsocks-libev-server
    服务端/
    └── usr/
        └── bin/
            └── ss-server      // 服务端可执行文件
    

ChinaDNS

GitHubhttps://github.com/aa65535/openwrt-chinadns
原版ChinaDNS地址, 被请喝茶后已不再维护:https://github.com/shadowsocks/ChinaDNS
luci-app-chinadnshttps://github.com/aa65535/openwrt-dist-luci

更新 /etc/chinadns_chnroute.txt

1
 wget -O- 'http://ftp.apnic.net/apnic/stats/apnic/delegated-apnic-latest' | awk -F\| '/CN\|ipv4/ { printf("%s/%d\n", $4, 32-log($5)/log(2)) }' > /etc/chinadns_chnroute.txt

dns-forwarder

GitHubhttps://github.com/aa65535/openwrt-dns-forwarder
luci-app-dns-forwarderhttps://github.com/aa65535/openwrt-dist-luci

dnsmasq

openWRT自带, 无需自行下载安装.
GitHubhttps://github.com/aa65535/openwrt-dnsmasq

Install

去软件项目的GitHub主页 -> Releases下面下载编译好的ipk, 如果没有符合的自己CPU架构的包, 则需要自己下载openWRT的SDK进行编译, 具体的教程各个主页上有.
查看CPU架构的命令 opkg print-architecture:

1
2
3
4
5
root@OpenWrt:~# opkg print-architecture
arch all 1
arch noarch 1
arch mipsel_24kc 10
root@OpenWrt:~#

下载完成有两种方式安装
方式一(建议): 通过web使用luci安装: 路径: 系统 -> Software -> Upload Package… -> Install

方式二: 直接在线通过opkg命令来安装(注意使用方式需要提前更新好软件源, opkg update):

1
opkg install luci-compat

Config

方式一, 使用luci来配置

登录luci.

  1. 配置ss-server
    服务 -> 影梭 -> 服务器管理, 添加自己的shadowsocks server
  2. 配置dnsmasq
    • 网络 -> DHCP/DNS -> 常规设置 -> 本地服务器, 设置为 127.0.0.1#5353
    • 网络 -> DHCP/DNS -> HOSTS和解析文件, 勾选: 忽略解析文件
  3. 配置ChinaDNS
    服务 -> ChinaDNS
    监听端口: 5353
    上游服务器修改为: 114.114.114.114,127.0.0.1#5300
    这样国内DNS114.114.114.114可信DNS127.0.0.1#5353, 勾选 启用, 保存设置
  4. 配置dns-forwarder
    服务 -> DNS转发
    监听端口: 5300 监听地址: 0.0.0.0
    上游 DNS: 8.8.8.8 勾选, 启用 保存
  5. 配置shadowsocks 透明代理 + 访问控制
    服务 -> 影梭 -> 常规设置 -> 透明代理
    主服务器, 选择setp1中配置的ss-server, 保存.
    服务-> 影梭 -> 常规设置 -> 访问控制-> 外网区域
    被忽略IP列表, 选择 ChinaDNS路由表, 保存设置. 注意这里的优先级: (走代理IP列表 = 强制走代理IP) > (额外被忽略IP = 被忽略IP列表)
  6. 保存并应用 所有配置, reboot openWRT

方式二, 直接编辑/etc/config目录下的文件

课外阅读: UCI System UCI system

The abbreviation UCI stands for Unified Configuration Interface and is intended to centralize the configuration of OpenWrt.

/etc/config/shadowsocks

1
2
3
4
5
6
7
8
9
10
11
12
13
14
15
16
17
18
19
20
21
22
23
24
25
26
27
28
29
30
31
32
33
34
35
36
root@OpenWrt:~# cat /etc/config/shadowsocks

config general
  option startup_delay '0'

config transparent_proxy
  option udp_relay_server 'nil'
  option local_port '1234'
  option mtu '1492'
  list main_server 'cfg054a8f'

config socks5_proxy
  option local_port '1080'
  option mtu '1492'
  list server 'nil'

config port_forward
  option local_port '5300'
  option mtu '1492'
  option destination '8.8.8.8:53'
  list server 'nil'

config servers
  option fast_open '0'
  option no_delay '0'
  option timeout '60'
  option server '服务器地址,注意luci下这里只能是ip'
  option server_port '端口'
  option password '密码'
  option encrypt_method '加密方式'
  option alias 'ss服务别名'

config access_control
  option self_proxy '1'
  option lan_target 'SS_SPEC_WAN_AC'
  option wan_bp_list '/etc/chinadns_chnroute.txt'


/etc/config/dhcp

1
2
3
4
5
6
7
8
9
10
11
12
13
14
15
16
root@OpenWrt:~# cat /etc/config/dhcp

config dnsmasq
  option domainneeded '1'
  option localise_queries '1'
  option rebind_protection '1'
  option rebind_localhost '1'
  option domain 'lan'
  option expandhosts '1'
  option authoritative '1'
  option readethers '1'
  option leasefile '/tmp/dhcp.leases'
  option localservice '1'
  option local '127.0.0.1#5353'
  option noresolv '1'
...

/etc/config/chinadns

1
2
3
4
5
6
7
8
9
root@OpenWrt:~# cat /etc/config/chinadns

config chinadns
  option chnroute '/etc/chinadns_chnroute.txt'
  option addr '0.0.0.0'
  option port '5353'
  option bidirectional '1'
  option server '114.114.114.114,127.0.0.1#5300'
  option enable '1'

/etc/config/dns-forwarder

1
2
3
4
5
6
7
root@OpenWrt:~# cat /etc/config/dns-forwarder

config dns-forwarder
  option listen_addr '0.0.0.0'
  option listen_port '5300'
  option enable '1'
  option dns_servers '8.8.8.8'

验证配置是否生效

1
2
3
4
5
6
7
8
9
10
11
12
13
14
15
16
17
18
19
root@OpenWrt:~# netstat -lpn | grep ss
Proto Recv-Q Send-Q Local Address           Foreign Address         State       PID/Program name
tcp        0      0 0.0.0.0:1234            0.0.0.0:*               LISTEN      13469/ss-redir
root@OpenWrt:~# netstat -lpn | grep 5353
udp        0      0 0.0.0.0:5353            0.0.0.0:*                           1438/chinadns
root@OpenWrt:~# netstat -lpn | grep 5300
udp        0      0 0.0.0.0:5300            0.0.0.0:*                           12993/dns-forwarder
root@OpenWrt:~# netstat -lpn | grep 53
tcp        0      0 127.0.0.1:53            0.0.0.0:*               LISTEN      2254/dnsmasq
...

root@OpenWrt:~# nslookup google.com 127.0.0.1#5353
Server:       127.0.0.1
Address:  127.0.0.1#5353

Name:      google.com
Address 1: 142.250.72.238
Address 2: 2607:f8b0:4007:80d::200e
root@OpenWrt:~#

Issues

  • luci-app-shadowsocks 不支持domain的方式配置ss-server, 需要使用IP地址

Link

https://www.youtube.com/watch?v=2SPQYsMmltE&t=317s – 十年老程 openwrt shadowsocks安装配置对应的视频教程 http://snlcw.com/305.html – 上述教程对应的blog地址. https://www.youtube.com/channel/UCgo7XWK6MQBgKt0gBI6x3CA/videos – 十年老程的Youtube专栏,里面有各种科学上网的视频教程. https://openwrt.org/docs/guide-user/base-system/dhcp_configuration